 Agent Charting
 API
Render chart images, run technical analysis, or connect your own agent with REST and MCP.
Render your first chart
Choose a symbol, timeframe and date range. Receive a PNG rendered with the same chart engine and drawing layer as our terminal.
- 1
Start the API and create a key
Use a named, scoped key for your workspace. Keep it on your server.
Set up authentication - 2
Request a frozen chart window
The example requests Bitcoin’s four-hour chart for January 2023. You can also supply your own candles.
- 3
Retrieve the image
Download the PNG with the same Bearer key, or request inline base64 for your agent.
curl -X POST "$AGENT_CHARTING_URL/v1/charts/renders" \
  -H "Authorization: Bearer $AGENT_CHARTING_API_KEY" \
  -H "Content-Type: application/json" \
  -H "Idempotency-Key: my-chart-request-001" \
  -d '{
  "market": {
    "symbol": "BINANCE:BTCUSDT",
    "interval": "240",
    "range": {
      "from": "2023-01-01T00:00:00Z",
      "to": "2023-02-01T00:00:00Z"
    }
  },
  "view": {
    "width": 1280,
    "height": 720,
    "theme": "dark",
    "includeVolume": true
  }
}'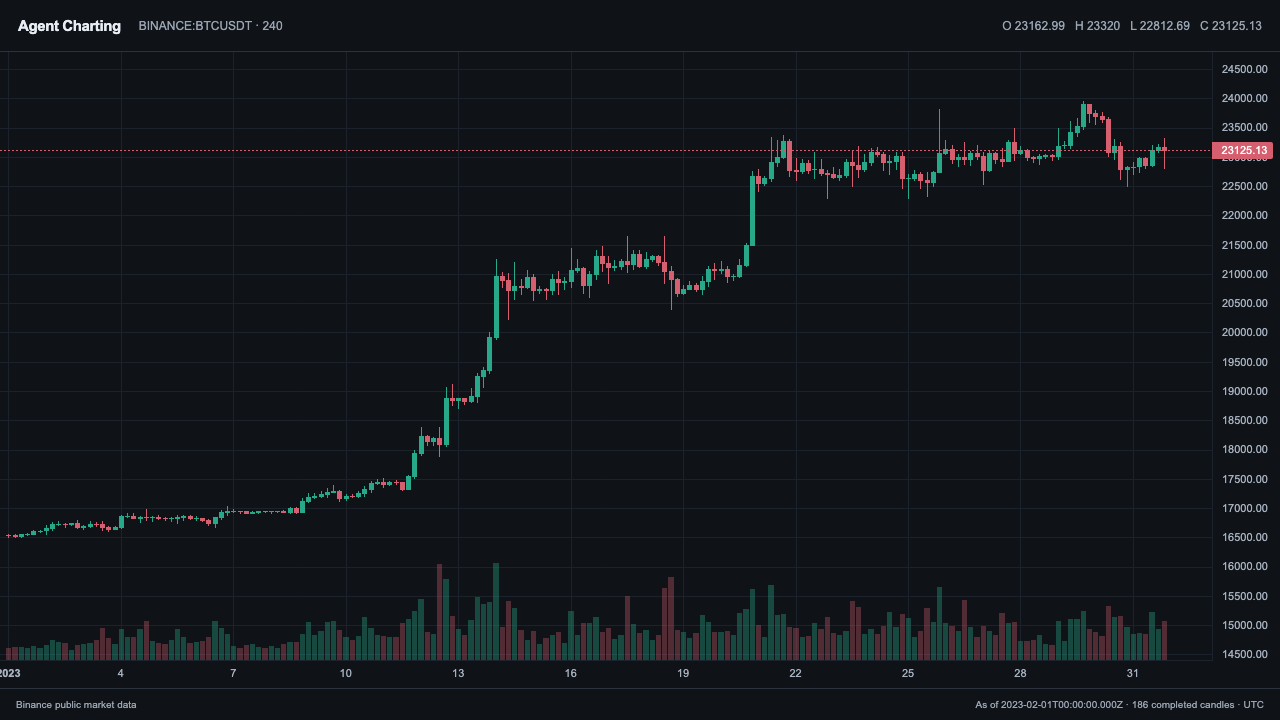
Bitcoin · 4-hour candles · January 2023. Rendered with the terminal’s chart engine, without a model call.
API reference
Chart images
Current or historical windows, your candles, and optional drawings.
Managed analysis
Vision-first reasoning, editable drawings, a thesis and a Setup.
Chart conversations
Continue an owned analysis with its existing chart state.
MCP tools
Return real image content to an assistant—not just JSON.